The Progress Matrix measures progress for an individual year group and subject over a time frame that you specify. Displaying progress both as a matrix and in bar charts, teachers can quickly identify how much progress each learner has made. An essential addition to any pupil progress review meeting.
How to configure the Progress Matrix
Open the Filter and select the year group and subject you want to analyse progress for.
Open Display Options and choose your Range for progress (a Fixed Range is recommended for this report).
Click Refresh and then close the Display Options.
Interpreting the Progress Matrix
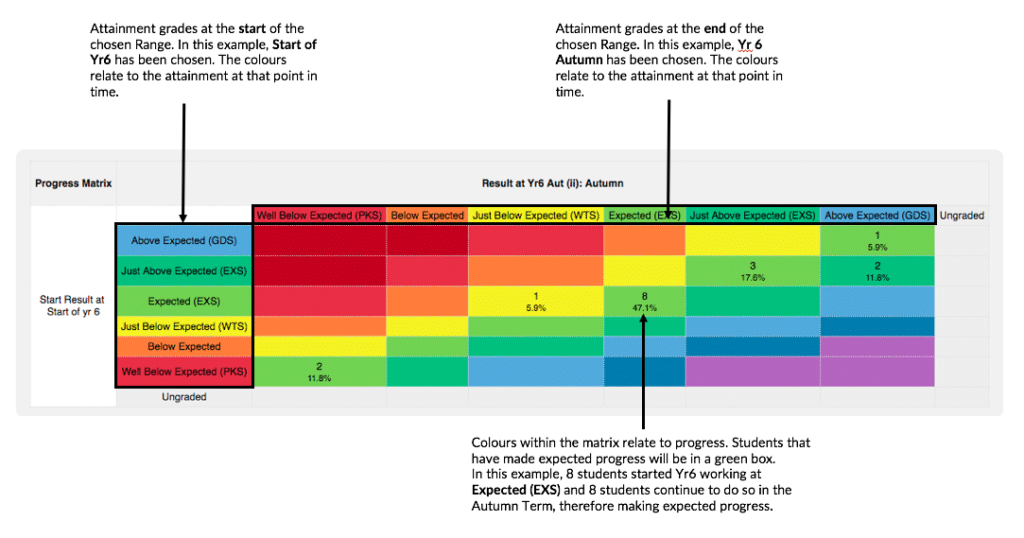
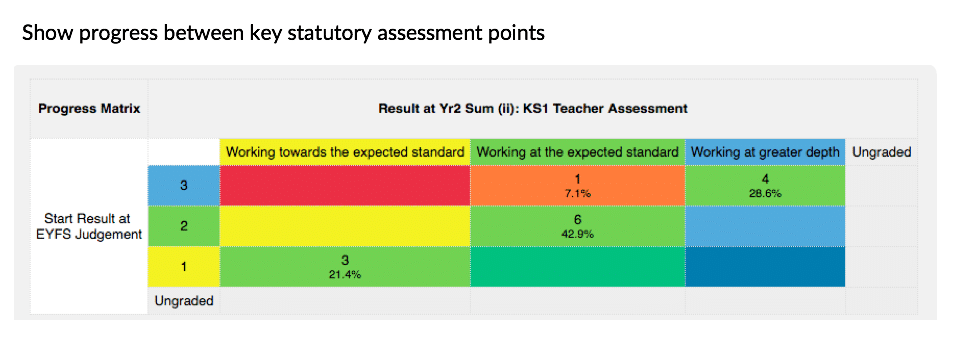
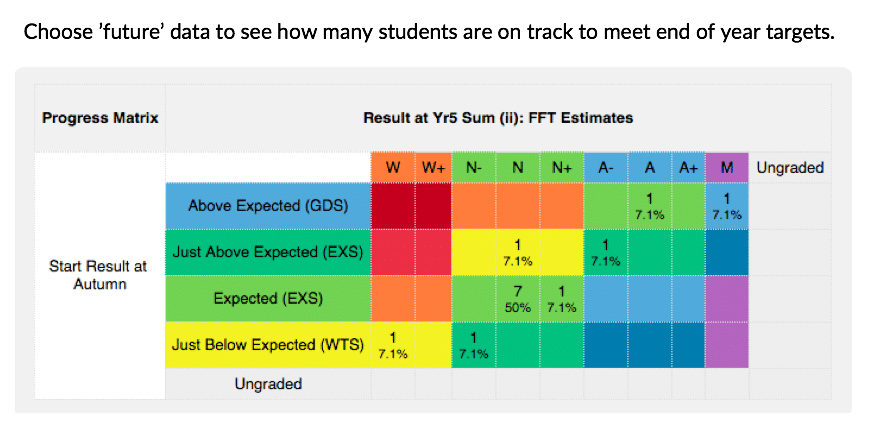
The Progress Matrix shows attainment colours for the start and end dates you select, plotting each pupil at the intersection of those two grades within the grid.
Using the Pupil Asset colours, it is quick and easy to see how much progress pupils have made from their respective baselines.
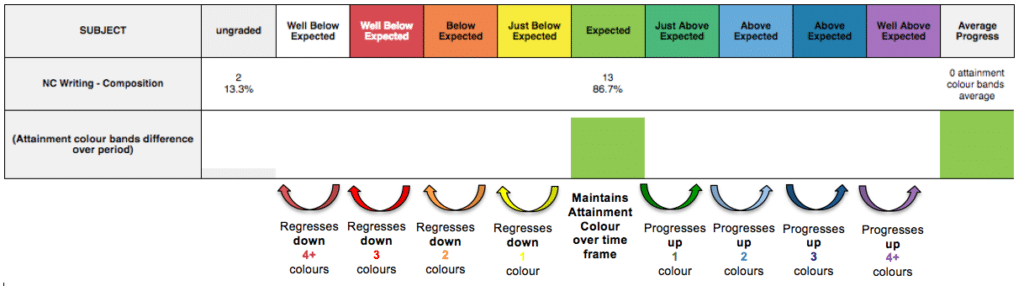
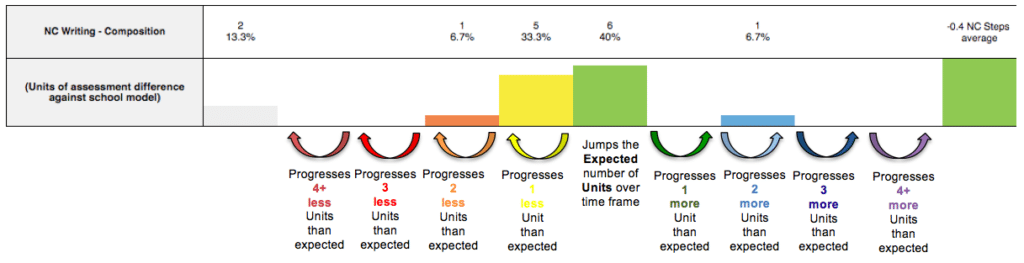
Below, bar charts summarise the progress data displayed in the Matrix. Each bar chart uses a different unit of measurement, giving a different degree of accuracy to your progress calculations. Choose the most appropriate measure of progress based on the information below:
Attainment Colour Bands (always displayed) – Most appropriate for measuring progress on a relative approach to assessment such as a Point in Time Assessment or when measuring progress through GCSE Grades. Here, expected progress is defined as a pupil retaining the same attainment colour over time i.e. being Expectedat the Start of Year 6 and continuing to work at the Expected level over the period of time defined in the Range to Use.
The idea of retaining colour over time can also be applied to a linear/levels result type where pupils progress from one level to the next. In this case, a student will need to ‘jump’ through a certain number of grades in order to retain their colour. However, generally, schools using linear approaches to tracking will use Units of Assessment and Points (see below) to measure progress as these provide more accurate progress measures.
Units of Assessment – On a relative approach to assessment, this indicates how many grades a pupil has increased or decreased over the time frame. In many cases, the defined Units of Assessment will be the same as the colours (i.e. each grade has been allocated a different colour). Retaining the same grade overtime is expected. Moving up through the grades illustrates better than expected progress and moving down through the grades indicates less than expected progress.
On a linear/levels approach, this indicates how many ‘Units of Assessment’ a pupil has added over the time frame. Expected progress is defined as jumping a certain number of grades or Units. This will be determined by your school’s particular set-up and the time frame you are measuring progress over. Making more ‘jumps’ is defined as better than expected progress, and making fewer jumps indicates that less than expected progress has been made.
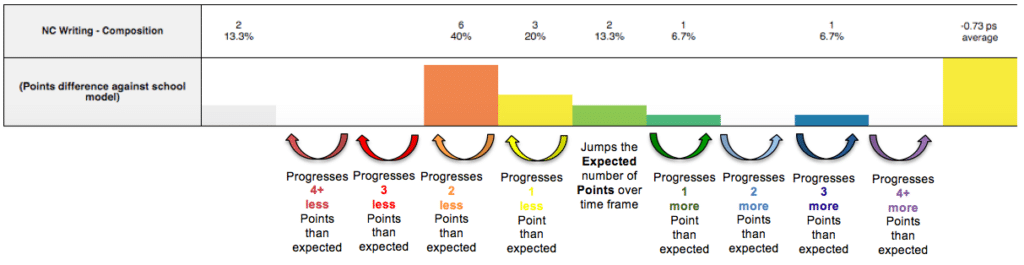
Points – Not relevant to a relative approach to assessment.
On a linear/levels approach, this indicates how many Pupil Asset Points a pupil has added (or not added) over the specified Range to Use.
Expected progress is defined as making the necessary number of points through the set of grades you use. A specified number of Points represents expected progress. This will be determined by your school’s particular set-up and the time frame you are measuring progress over. Where pupils have made the required number of points, they will be judged to have made expected progress. If they have added more points, this indicates better than expected progress. If a learner has added fewer points than expected, this indicates that less than expected progress has been made.
The report doesn’t have any pupils in it?
You must have summative assessment data saved at the two points you are measuring progress between. Within Display Options ensure the Range to Use is as you had intended (a Fixed Range is recommended for this report). If necessary, navigate to Results > Results and check your data is saved in the columns you have selected. Where necessary, change the Range to Use .
The attainment terminology used is not as expected
This is likely to be due to not using a Fixed Range, as recommended. When ‘earliest’ or ‘latest’ results are chosen, the system is unable to define a single assessment terminology as it may be drawing results from different results columns (it is viable that some students e.g. ‘latest’ result differs to that of their peers). In these cases, the system can only display the Pupil Asset Points that sit behind the colours. Defining exactly which results column you would like the system to dsiplay will rectify this.
The percentages aren’t what I had expected?
Check the Ungraded column on the left-hand side of the report. Are there any pupils without results for the subject and Range to Use you have selected? Pupils without results are still included in percentage calculations, so percentages may be lower than anticipated if not all pupils have a result. Results may be missing either at the start of the Range to Use, the end or at both points.