The Progress Bands report measures progress for either an individual year group or for the whole school. It can report on one or multiple subjects, depending on the Display Options selected. As a year group report, Progress Bands facilitates easy comparison of individual’s and cohort’s progress across the curriculum. When the Whole School filter is selected, subject leaders can quickly identify trends in progress across the school in the subject(s) they are responsible for.
How to configure the Progress Bands report
Open the Filter, and select the Year Group you want to analyse progress for (or whole school, if desired).
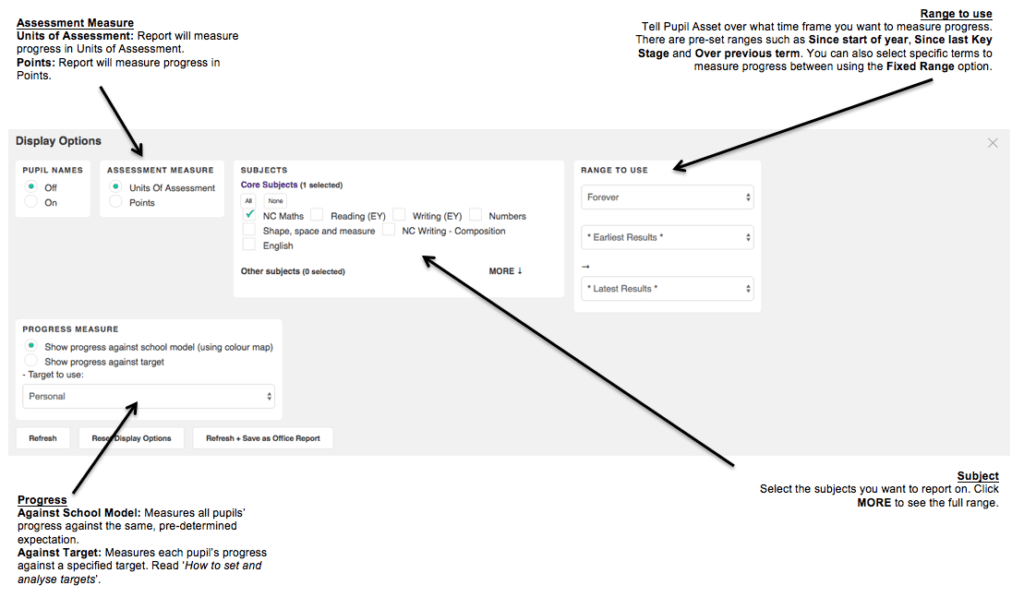
Open Display Options and choose your Range for progress.
Click Refresh and close the Display Options.
Interpreting the Progress Bands report
These notes assume you are measuring progress against School Model. If you are using the Progress Bands report to show progress against targets please see the ‘How to set and analyse targets‘ help notes.
The Progress Bands report represents progress data in a series of columns (or bands) showing which pupils have made expected, above expected and below expected progress.
Depending on the Assessment Measure chosen, the report measures progress in Units of Assessment or Points.
NB: Points are not always an appropriate measure e.g. for relative/flat result types such as a Point in Time Assessment or GCSE Grades.
Measuring in Units of Assessment
– Relative/flat model: Expected progress is achieved by retaining a grade over time. Better than and less than expected progress indicate that a learner has moved up or down through the grades respectively.
– Linear model: Expected progress is defined as having ‘jumped’ the required Units of Assessment over the time frame selected.
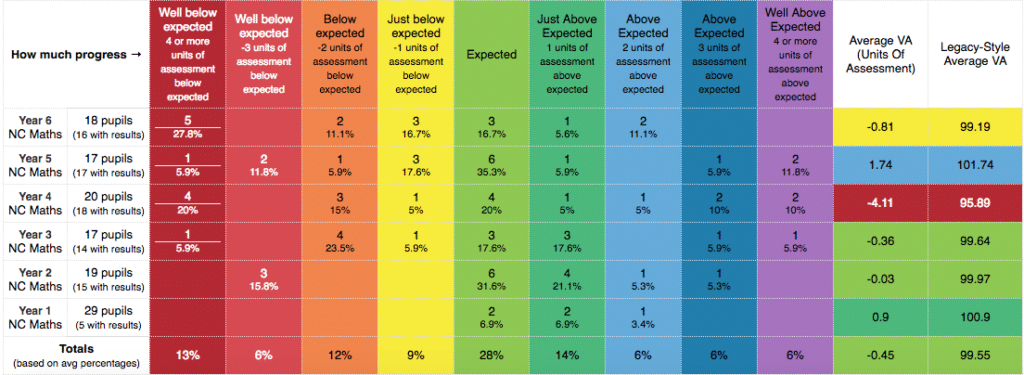
Average VA (Units of Assessment) – The Units of Assessment that each year group has, on average, added (+) over and above expected progress. This can also be a negative (-) value. A value of 0 represents expected progress.
Legacy-Style Average VA (optional) – This measure scales the Average VA (Unit of Assessment) score such that 100 represents expected progress. Values above 100 indicate that a year group, on average, has made more progress than is expected, whilst values below 100 indicate that less than expected progress was made, on average.
Measuring in Points
– Relative/flat model: Not suitable.
– Linear model: Indicates how many Pupil Asset Points a pupil has added (or not added) over the time frame. Expected progress is defined as having ‘jumped’ the required number of Point.
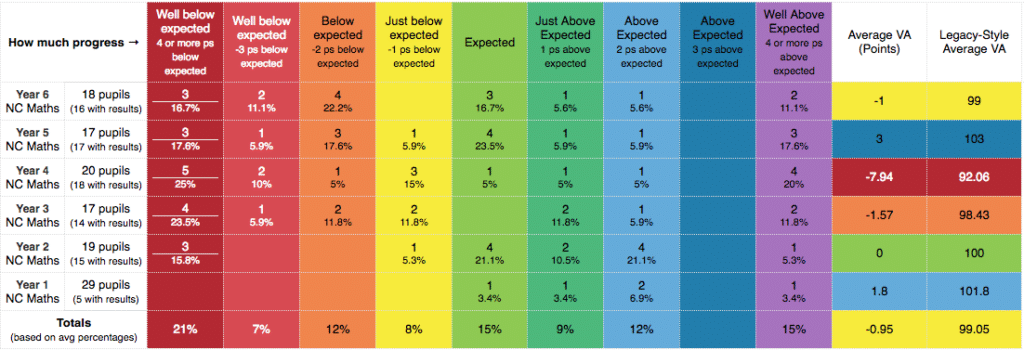
Average VA (Points) – The Points that each year group has, on average, added (+) over and above expected progress. This can also be a negative (-) value. A value of 0 represents expected progress.
Legacy-Style Average VA (optional) – This measure scales the Average VA (Points) score such that 100 represents expected progress. Values above 100 indicate that a year group, on average, has made more progress than is expected, whilst values below 100 indicate that less than expected progress was made, on average.
Troubleshooting
The report doesn’t have any pupils in it?
You must have summative assessment data saved at the two points you are measuring progress between. Within Display Options ensure the Range to Use is as you had intended. If necessary, navigate to Results > Results and check your data is saved in the columns you have selected.
The percentages aren’t what I had expected?
Check the Ungraded column on the left-hand side of the report. Are there any pupils without results for the subject(s) and chosen range? Pupils without results are still included in percentage calculations, so percentages may be lower than anticipated if not all pupils have a result. Pupils without results may be missing either a result at the start of the Range to Use, the end or at both points.
My average VA measures are not what I had expected?
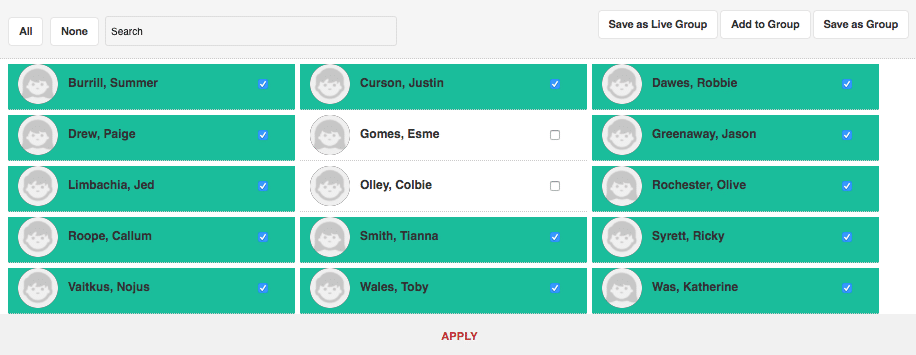
Bear in mind that, like any average score, Value Added measures can be heavily influenced by data at the extremes. As such, a small number of pupils with particularly strong or weak progress can influence the average Value Added score presented. It may be appropriate in some circumstances, to remove individuals from the report. To do this, click on the number of pupils in the grey box directly to the right of the word Filter:
– Select All pupils
– Deselect those pupils you’d like to remove from the report
– Press Apply. The report will re-configure based on the new set of pupils you have selected