The Points/Units of Progress report measures progress for an individual year group for one or multiple subjects. It reports on progress in terms of the number of Points or Units of Assessment each learner has progressed and compares this with what was Expected. It is a great way of comparing pupils’ progress across the curriculum and enables teachers to identify areas of strength and weakness.
How to configure the Points/Units of Progress Report
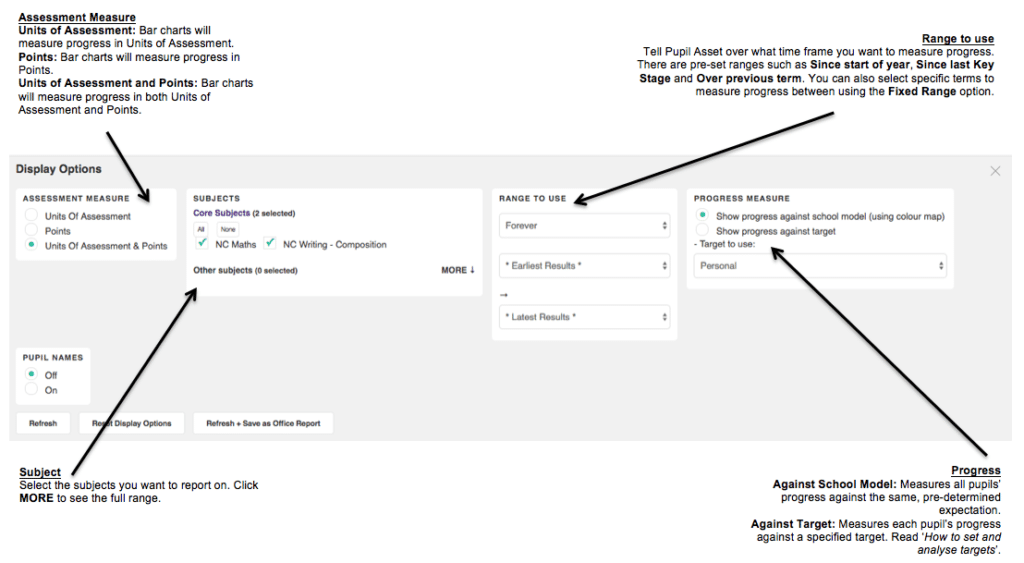
Open the Filter and select the year group you want to analyse progress for.
Open Display Options and set your parameters.
Click Refresh and close the Display Options.
Interpreting the Points/Units Progress report
These notes assume you are measuring progress ‘against School Model’.
If you are using the Points/Units Progress report to ‘show progress against targets’ please see the ‘How to set and analyse targets‘ help notes.
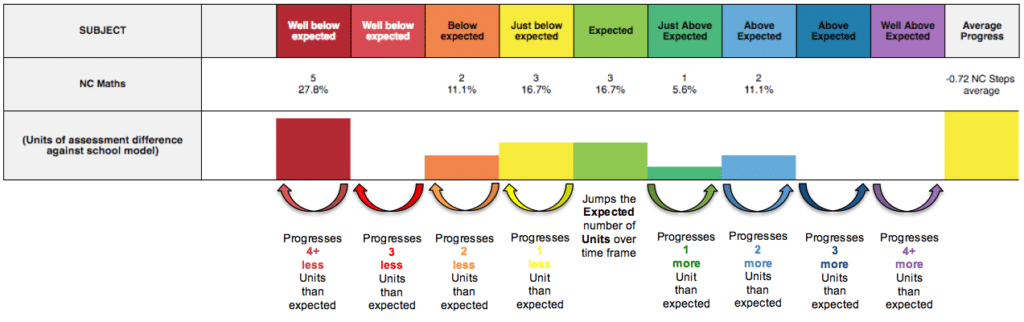
The Points/Units Progress report represents progress data in a series of bar charts that show whether pupils are making expected, above expected or below expected progress.
Depending on the Assessment Measure chosen, the report measures progress in Units of Assessment or Points.
NB: Points are not always an appropriate measure e.g. for relative/flat result types such as a Point in Time Assessment or GCSE Grades.
Units of Assessment
– Relative/flat model: Expected progress is achieved by retaining a grade over time. Better than and less than expected progress indicates that a learner has moved up or down through the grades respectively.
– Linear model: Expected progress is defined as having ‘jumped’ the required ‘Units of Assessment’ over the time frame selected.
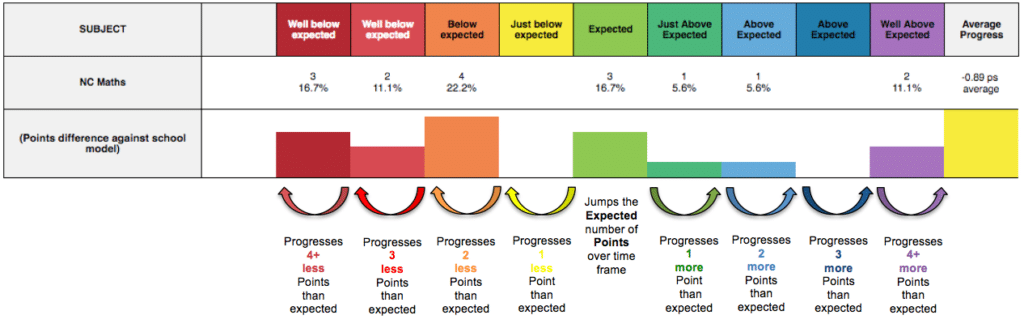
Points
– Relative/flat model: Not suitable.
– Linear model: Indicates how many ‘Pupil Asset Points’ a pupil has added (or not added) over the time frame. Expected progress is defined as having “jumped” the required number of ‘Points’.
Troubleshooting
The report doesn’t have any pupils in it?
You must have summative assessment data saved at the two points you are measuring progress between. Within Display Options ensure the Range to Use is as you had intended. If necessary, navigate to Results > Results and check your data is saved in the columns you have selected.
The percentages are not what I had expected?
Check the Ungraded column on the left-hand side of the report. Are there any pupils without results for the subject(s) and chosen range? Pupils without results are still included in percentage calculations, so percentages may be lower than anticipated if not all pupils have a result. Pupils without results may be missing either a result at the start of the Range to Use, the end or at both points.