The Colour Bands report shows attainment using the Pupil Asset colours, providing a detailed overview of achievement without getting ‘bogged down’ in the specific grade each pupil attained.
This is incredibly useful when sharing data with stakeholders who may not be familiar with your particular approach to in-school tracking or when looking at whole school data where each year group potentially has a different definition of ‘expected’ at that point in time.
It can also be used to compare a range of result types, for example, Teacher Assessments alongside standardised test results.
For class teachers, the report analyses attainment in a specified subject and displays both current and historic data so that trends over time can be identified. For subject leaders, the report can be configured to show attainment across the Whole School, making it easier to identify strengths and weaknesses in a particular subject and to set future priorities.
How to configure the Colour Bands report
Open the Filter and select the year group or cohort of pupils you want to analyse progress for.
Remaining in the Filter, select the Subject you want to report on. If the subject is already displayed, ensure its name appears in green font, indicating that the subject is active. If not, click the ‘on/standby‘ button on the right-hand side of the subject box.
If you have selected Whole School, open the Display Options and choose the data you want to report on from the Test Rows list.
If required, you can also turn pupil names On or Off within Display Options.
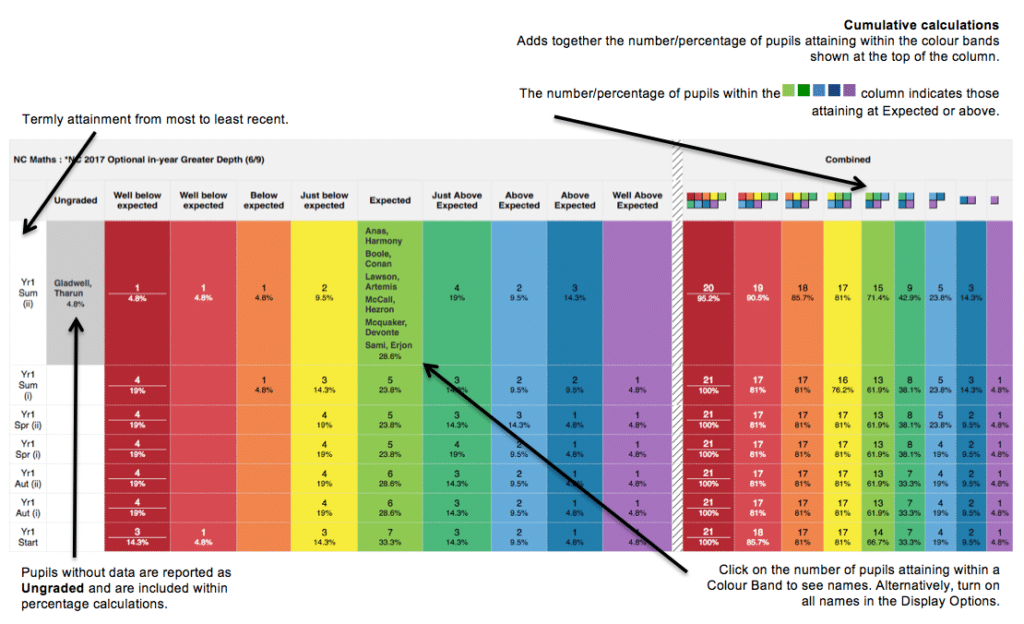
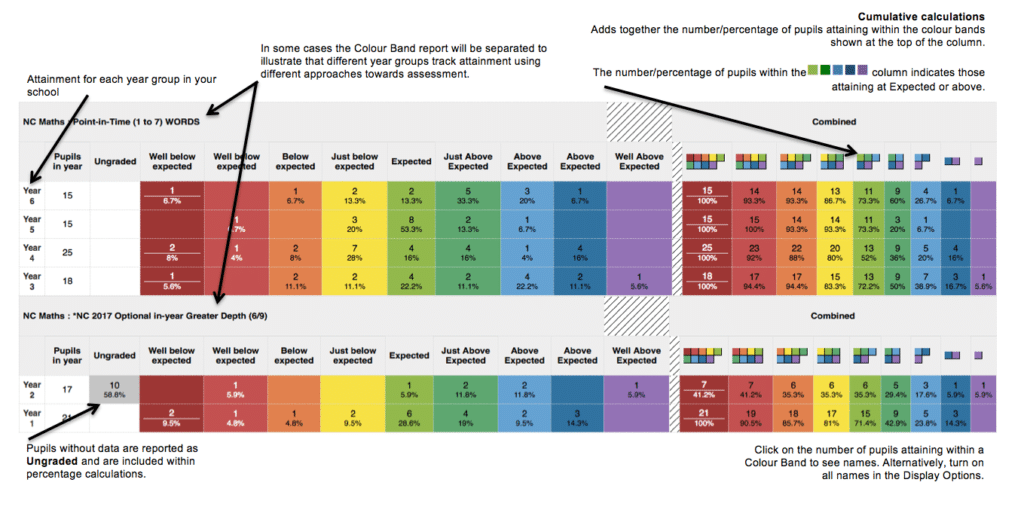
Interpreting the Colour Bands report
One year group
Whole School
Troubleshooting
My report is blank
A report is likely to be blank if data hasn’t been inputted for the year group and subject you have selected. Where data has not been added, all pupils will be listed in the Ungraded column on the left-hand side of the report.
If you have filtered the Whole School, ensure you have selected the appropriate column of data from the Test Rows list within Display Options.
The percentages are not what I had expected
Check the Ungraded column on the left-hand side of the report. Are there any pupils without results for the subject you have chosen?
Pupils without results are still included in percentage calculations, so percentages at Expected may be lower than anticipated if not all pupils have a result.