Where schools wish to set different progress expectations for learners, Pupil Asset facilitates this through target setting. Once targets are set, schools can compare learners’ actual attainment with their projected performance, analysing whether they are performing above, below or in line with these personalised expectations.
This page is designed for mainstream settings where personalised progress measures are likely to be used alongside more conventional, whole-school progress expectations. SEN(D) settings should see the help page ‘How to personalise progress expectations in a SEN(D) setting‘.
Configuring your settings
Schools can choose whether to set 1, 2 or 3 targets. To choose the desired number of targets, navigate to Admin > School Options > Tracking Options and scroll down to Progress & Targets.
In the drop-down box next to Number of targets to track, select the required number and click Save Tracking Options at the bottom of the page. Once these changes are saved, you can then rename the targets by pressing Rename Targets. Finish by clicking Save and then Save Tracking Options at the bottom of the page.
Creating targets
Navigate to Results > Results and use the Filter Block to choose the students and subject you want to set targets for. Targets must be set for each year group in turn, but can be set for multiple subjects simultaneously.
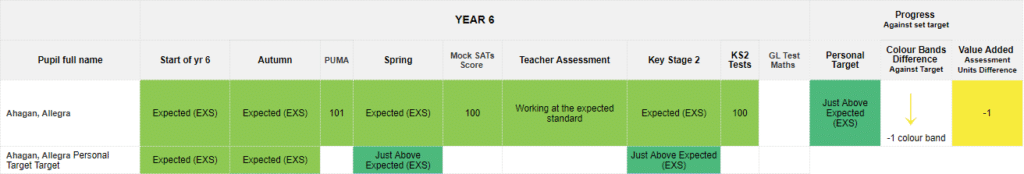
Under Display Options, turn Results or Targets to Both. Each learner’s result (top line) and target (underneath) will now appear (NB targets are derived from a pre-existing result. Results need to have been previously inputted).
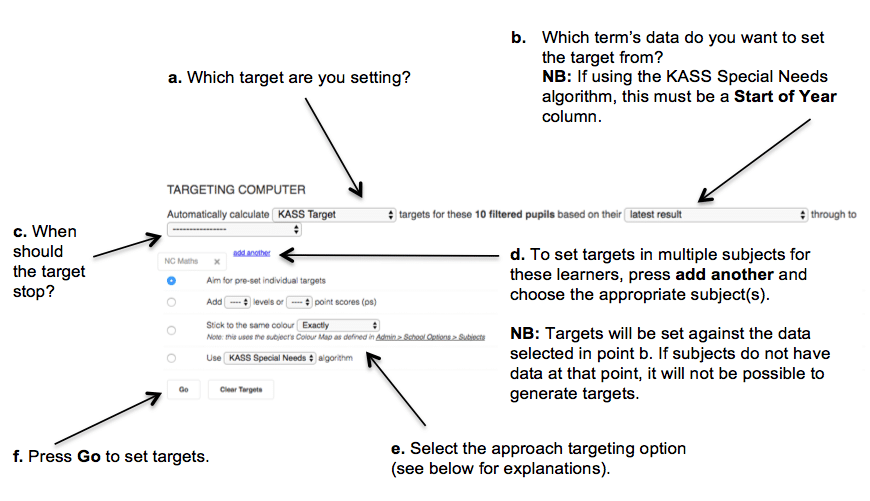
Click Targeting Computer and review each of the options (see below for a detailed explanation of all available options).
Once you have pressed Go, the page will refresh and show targets from the chosen start point (b) to end point (c). You may see a confirmatory message that Targets have been set. Scroll past this and the usual web page will appear below.
Targeting options
Option 1: Aim for pre-set, individual targets
In addition to entering a baseline result, you will also need to manually enter the target before pressing GO. Having already chosen to Edit Targets, ‘target rows’ should now appear and can be edited (if not, click Edit Targets ). Enter a target grade in the chosen term from point c. Where multiple targets are displayed, be careful to add the target into the correct target line. Pressing GO will now calculate termly targets, based on the manually inputted end target.
Option 2: Make a specific amount of progress
Add either a specific number of levels or points between the baseline result (point b) and end-point (point c).
Option 3: Stick to the same colour
Target pupils to maintain the colour of their attainment at point b or change expectations by skewing the target by 1 or more colour bands. The Targeting Computer will distribute the necessary progress such that the specified attainment colour is reached by point c.
Option 4: Use KASS Special Needs algorithm
Set progression targets against the Kent Association of Special School’s progress expectations for learners attaining between P1 and the Year 11 age-related expectations. Users are encouraged to contact the Pupil Asset Support Team for more information (01603) 631436.
How do I compare results and targets?
Once targets are set and at least one further column of results has been entered into Pupil Asset, results can be compared against targets and progress measures produced.
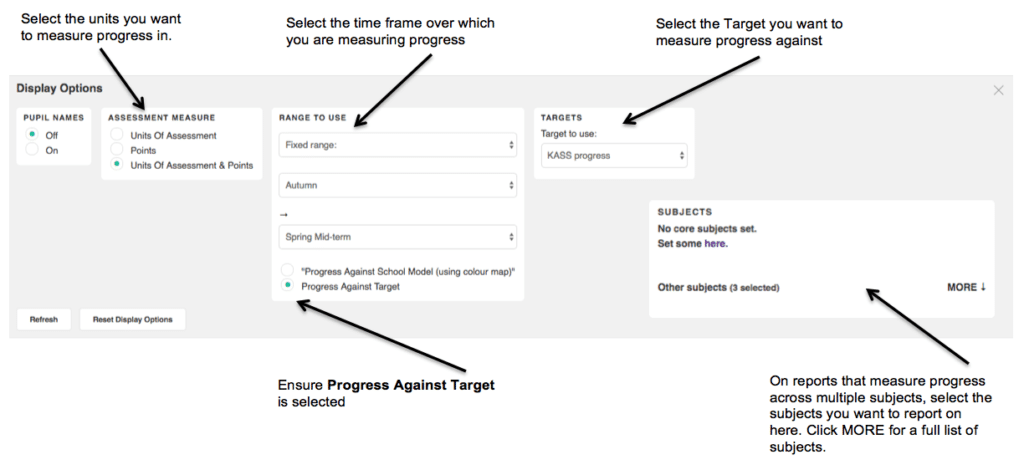
On the Results > Results page, within the Display Options under PROGRESS select Progress Against Target – Target to use.
From the drop-down menu select the target you wish to measure progress against.
Choose the Range to Use. That is the two points in time between which you wish to measure progress.
Reporting on personalised progress
The full range of Progress reports can be used to analyse learners’ progress against targets. Simply configure the Display Options for each report to measure against targets instead of the school’s standard model of progress.
Results v. Targets
This report is particularly relevant to schools measuring performance against targets. It compares each learner’s grade to their target, reporting whether they are Above, On or Below target.
For more information on using this report, see ‘How to use the Results vs Targets report‘
Progress Matrix
Be aware that a matrix cannot be displayed when measuring Progress Against Targets. This is because each box within the Matrix would need to be a different colour for each learner! Instead, users can use the Bar Charts at the bottom of the page.
These Bar Charts categorise learners’ progress using the Pupil Asset Colour Key. Learners have made Expected progress when their result and target match. For learners with Below Expected Progress, their result is below their target whereas for learners with Above Expected Progress, their result is above their target. B y default, this information is expressed as number of learners and the percentage of the Filtered cohort that they represent. Click on the number of learners, to see who they are.
For more information on using the Progress Matrix, see ‘How to use the Progress Matrix report‘
Units/Points of Progress
As a way of reporting on targets, this is very similar to the Progress Matrix report. The number of Units or Points a learner has added/not added over the specified range (their results) is compared against the number of Units or Points they were supposed to progress (their target). Colour Band Differences are not included in this report as they are not a Points or Units-based measure.The benefit of this report is that it measures progress over multiple subjects simultaneously.
For more information on using this report, see ‘ How to use the Units/Point Progress report ‘.
Progress Bands
Progress Bands also shows the number of Units or Points a learner has added/not added over the specified range (their results) compared against the number of Units or Points they were supposed to progress (their target). It’s benefits are the simplicity of viewing a single progress metric, across multiple subjects and that the whole school can be captured on one page. This report also calculates progress averages for each subject, presenting progress across a year group, class or cohort in one figure. Progress scores can also be averaged over subjects.
For more information on using this report, see ‘ How to use the Progress Bands report