Pupil Asset comes with an in-built provision mapping tool.
Users have the ability to record the cost of any intervention or extra-curricular activity against any particular pupil group. This is especially useful if you wish to show the impact of your provision on your pupils’ attainment and progress or measure the effectiveness of different interventions.
Setting up provision mapped groups
For help on creating basic groups, see ‘How to set up groups‘.
Users can choose whether a group is provision mapped when it is first created via Pupils > Groups, or they can go back and Edit a group at a later date.
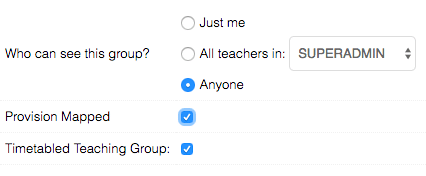
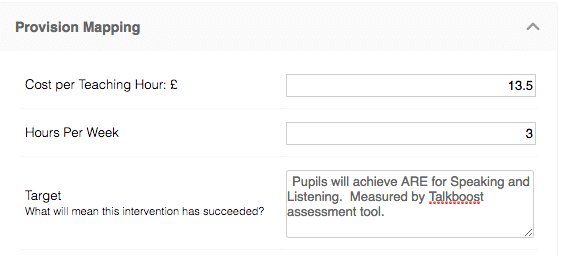
Once the Provision Mapped box has been ticked, an additional section in the Edit/Create Group enables users to assign a cost for the intervention and a target that will indicate whether the provision has been successful.
Viewing provision mapped groups
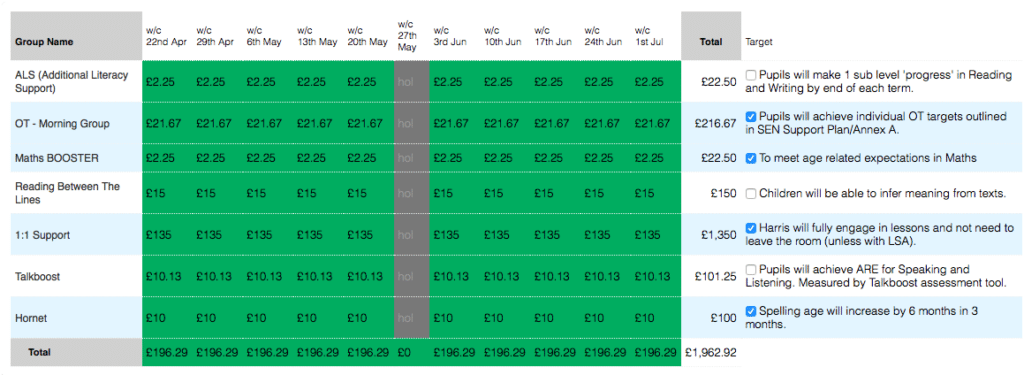
To view all the Provision Mapped groups, navigate to Pupils > Groups > Provision Mapping.
This page will show a breakdown of each group, including cost per week, cost per pupil (for the chosen timeframe) and whether pupils are registered as SEN or Pupil Premium (or both).
Use the Display Options to change the date ranges displayed or to choose specific groups.
Here you can also tick against the pupils who have achieved the target (note that if you want to track an individual’s targets you will need to create a group just for them).
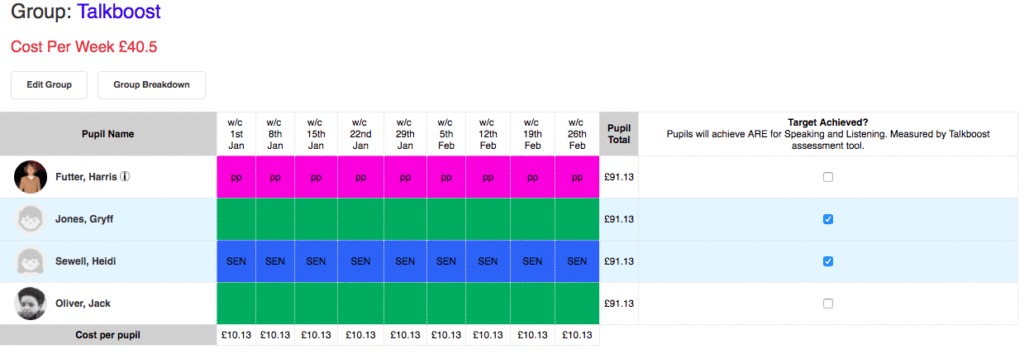
Clicking the Group Breakdown button will take users to a page that enables them to see the statistics and breakdown of that particular group.
For a more detailed analysis, average progress for associated subjects can be viewed at the bottom of the page in Results > Results or as percentage increases via the DNA Ticks page, using the Ghost Rows. For example, if you have put in place an intervention to support Maths, you can see how this is effecting the pupils’ overall Maths results in NC Maths. If the group’s average progress is greater than the rest of the cohort, it could indicate that the provision has been successful and cost effective.
Provision Map Overview
Users are also able to look at provision mapping across the whole school on one page via the Provision Map Overview via Pupils > Provision Mapping > Provision Map Overview.
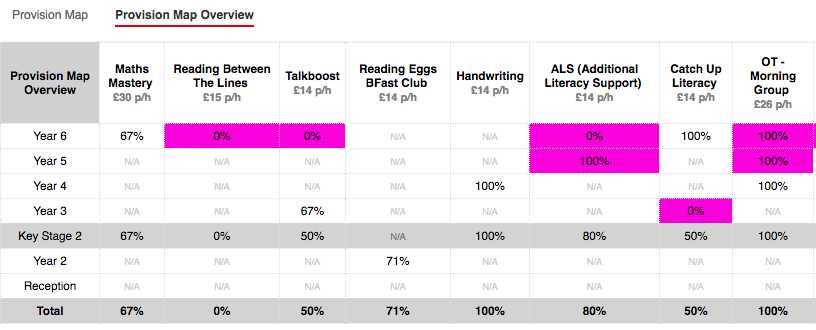
From here, the percentages of pupils in each group who have achieved their targets can be viewed and the cost-effectiveness of different interventions compared. Any percentages in purple means that year group and pupil group contains at least one pupil premium status pupil.
Viewing an individual student’s Provision Map
Every child that is added to a Provision Mapped group will have their own, personal Provision Map. To view provision, click on the pupil’s name to get into their profile. On the left hand menu is a tab called Provision. Clicking this will bring you into the pupil’s Provision Map where you will be able to toggle on/off costs and choose different date ranges.