This is a basic guide for schools who have chosen to use a ‘stepped/linear’ assessment model (e.g. 4 Beg, 4 Dev etc.).
It will not be relevant if your school uses a Point-in-Time Assessment (PITA) model (e.g. Working At, Working Above).
For an explanation of how progress in measured when using a PITA model, see ‘ Point in Time Assessment ‘.
NB: Your School Model will have been set up with you when you first joined Pupil Asset. If you would like to make changes to your model, please contact Pupil Asset Support via Help > Support or by phoning (01603) 631 436.
Points, units of assessment and colour bands
Progress in Pupil Asset is controlled by two settings:
- Result Type – this decides what results can be recorded for that subject.
- Colour Map – this assigns a colour to results based on the stage in the year they were recorded.
Colour Progression Charts
The easiest way to see how result types and colour maps interact is to look at the colour progression chart for your subjects.
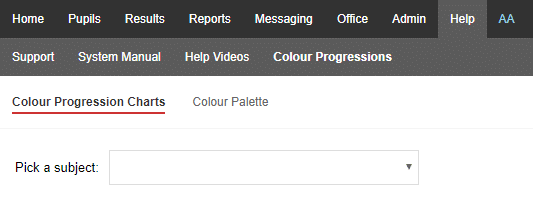
Navigate to Help > Colour Progressions > Colour Progression Charts and select a subject from the Pick a subject dropdown.
The colour progression chart will then show:
- All results from that Result Type listed on the left.
- Each years assessment stages listed along the top.
- A colour chart populated from that subject’s Colour Map .
The following is taken from a standard NC Bands result type and colour map:
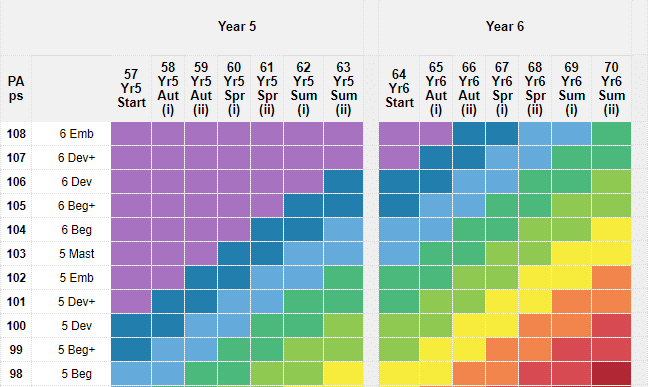
PA ps represents the Pupil Asset point score for each result. This is because the software does not read the specific language chosen e.g. 6 Beg, but the numbers that sit behind it.
Next to the point score (ps), is the result title – this is the terminology that you have chosen and what will show in the system when your Display Options are set to Units Of Assessment.
Working Examples:
A student assessed at 5 Dev (100ps) at the end of Year 5 would be in the top half of the light green band on the associated colour map. They would be reported as expected when looking at attainment.
A student assessed as 5 Mast (103ps) at the end of Year 5 would be in the bottom half of the light blue band on the associated colour map. They would be reported as above expected when looking at attainment.
A student who progresses from 5 Dev (100ps) at the end of Year 5 to 6Dev (106ps) at the end of Year 6 would be reported as having made expected progress (having moved from expected attainment and end of Year 5 to expected attainment at end of Year 6).
To better understand the difference between points and units it is worth noting that plus levels (or fine levels ) are generally* one ps point apart and Units of Assessment are generally* 2 points apart e.g.
6 Beg to 6 Dev = 1 Unit of Assessment = 2ps points.
6 Beg to 6 Beg+ = 0.5 Units of Assessment = 1ps point.
*This will of course depend on your agreed set-up. For example, if you do not have fine levels in your result type, then it is possible that your Unit of Assessments will be worth 1 ps point. NB – this is not the same as having the fine levels turned off – just because you can no longer see them, does not mean they are not still part of your result type!.
How does this look in the system?
Navigate to Results > Results.
Click on Display Options to open a menu where you can set the Range To Use. This controls the range of assessment data shown as well as the start and end point your progress judgements will be based on.
You can then control how your attainment and progress is displayed using the following three settings:
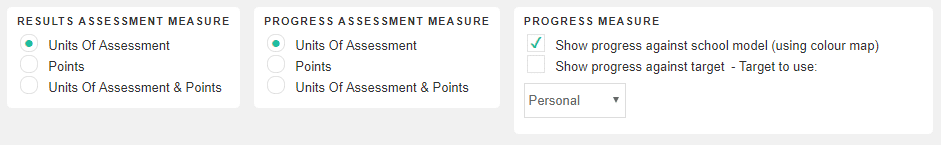
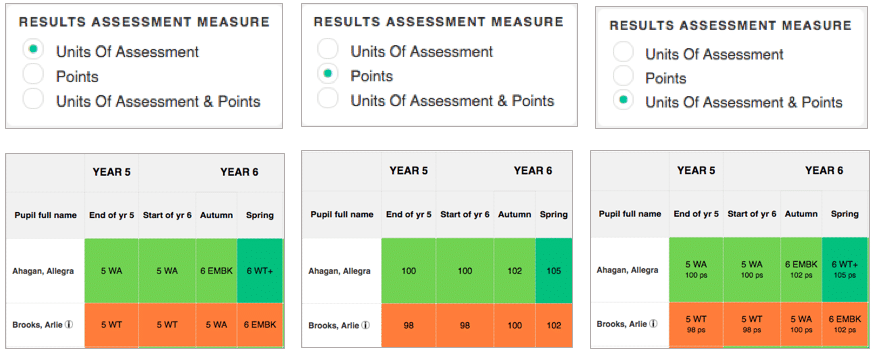
Results Assessment Measure – this controls whether your assessment data will show Units of Assessment (result titles), points scores (ps) or both together.
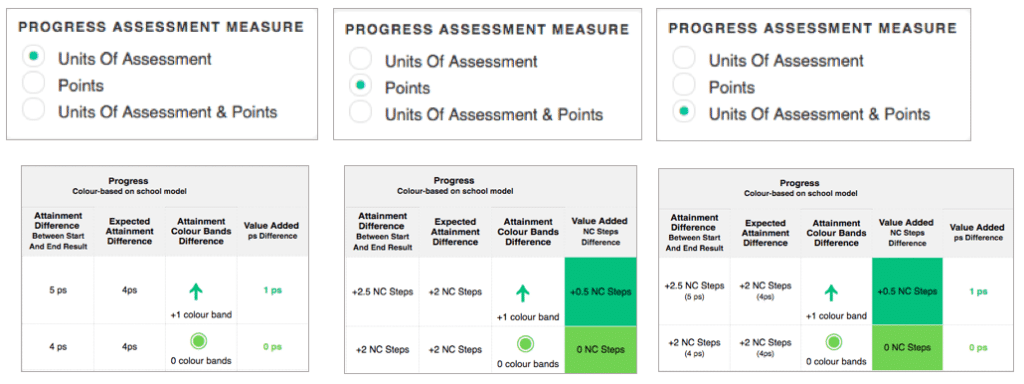
Progress Assessment Measure – this controls whether progress judgements will show Units of Assessment (results titles), points scores (ps), or both together.
Progress Measure – this can be set to school model to use your colour progression chart or it can be set to target to directly compare progress against a recorded target. For more information on setting targets, see ‘ How to set and analyse targets’.
So what about colour bands?
This is simply what colour has a student attained. So, referring back to the previous example, a student assessed at 100ps/5 Dev at the end of Year 5 would be in the light green colour band on the associated colour map.
Progress can be measured in its simplest terms by looking at colour. For example, a child who previously attained light green and is now blue would be reported as having made +2 colour bands progress.
This is particularly useful when measuring progress between mixed result types where it is not always possible to measure in either point of units of assessment, for example, a scaled score to a teacher assessment.
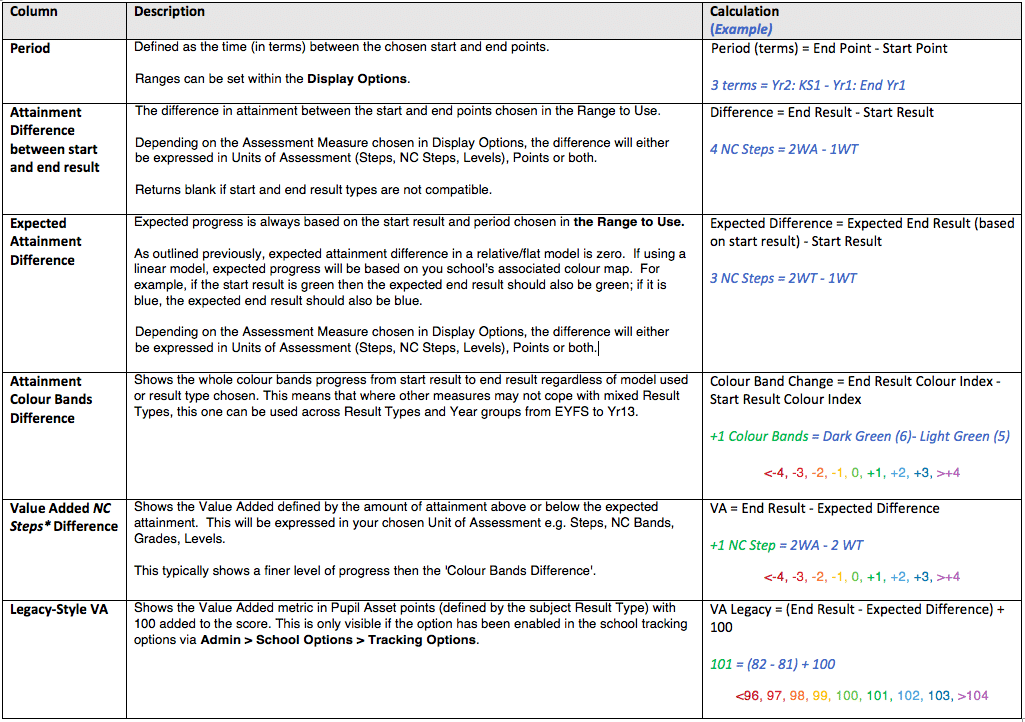
Progress Against School Model: Summary of Columns
The colours and calculations used are explained in more detail below: