To show attainment coverage and depth of learning, Pupil Asset creates an overview of achievements using a ‘DNA strip’. This shows each learner’s assessment at the age-level or levels selected.
Navigate to Results > DNA Ticks.
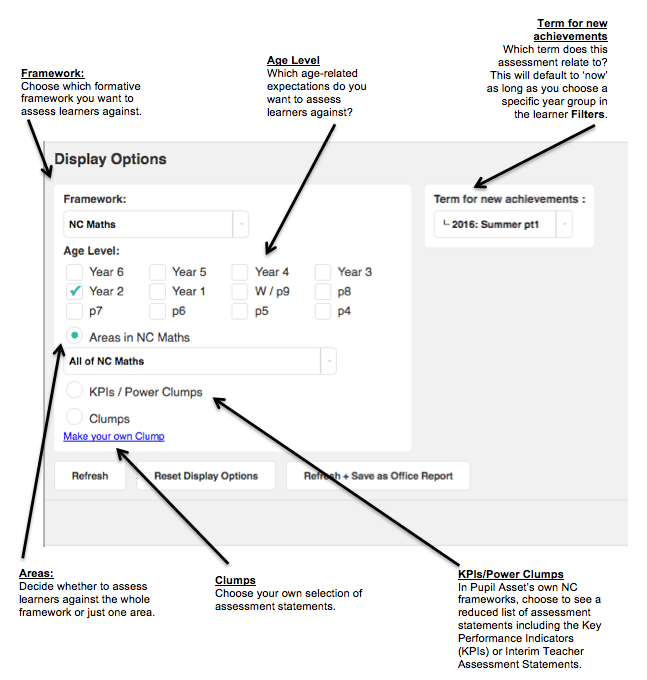
Use the Display Options to choose which framework you would like to view.
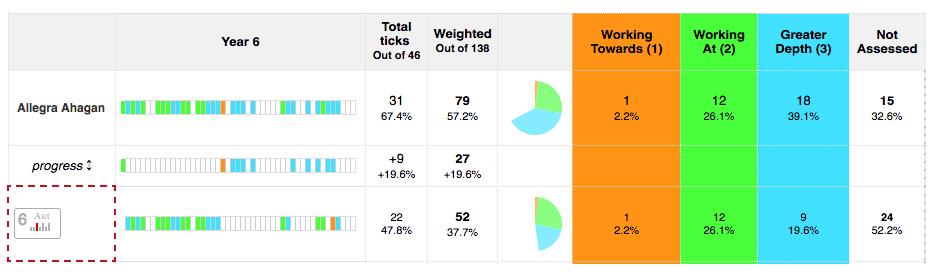
Multi-tick assessments are now summarised statistically, firstly as a Total and then sub-divided by the assessment terminology you use in your school. The top number is the number of statements achieved. This is then expressed as a percentage of the total directly underneath.
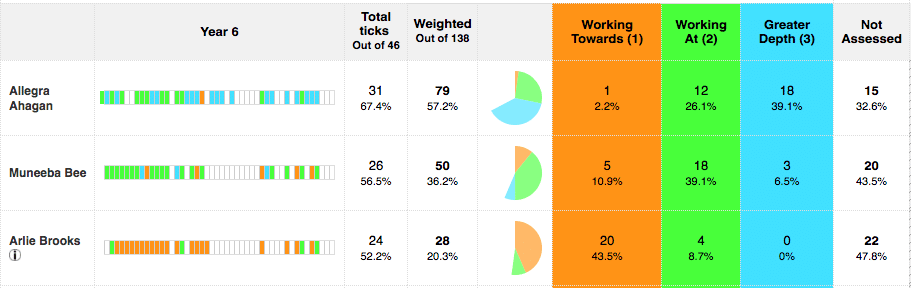
A growing number of schools are making use of Weighted Percentages. These convert formative assessments into an overall, aggregate percentage, expressing how much of the age-related expectations each learner has achieved. As learners acquire more skills and deepen their level of understanding, the weighted value increases. This Weighted Percentage allows schools and teachers to determine how far through a framework a learner has progressed and how deeply they have mastered the content taught.
The weightings given to judgements can be changed by amending the framework (see ‘How to set up/customise frameworks‘).
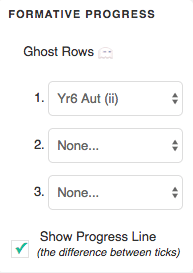
Ghost Rows
Using Ghost Rows, teachers can also make a direct comparison of up to four different assessment points, providing a representation of progress over time. Ghost Rows and the Progress Line can be turned on via Display Options.